Andy's Algorithm for Mapping

GlobeS.gif G1_2.gif      The basic concept for this method is that an " artificial equator" runs through the center of the mapped area. The band on the globe at the left illustrates this. The state of South Dakota in the United States was choosen as the area to map. The Band is shown passing through the middle of the state.
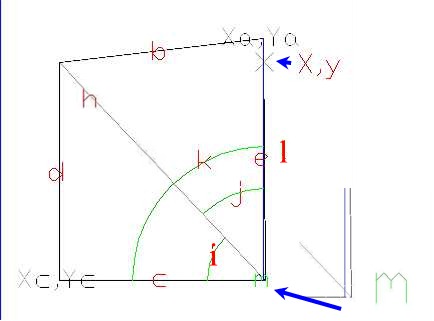
     The band representing the "artificial equator" crosses the real equator 90 degrees away from the center of the mapped area. At 180 degrees from the center of the mapped area, the "artificial equator" is at a lattitude that is the negative of that that the mapped area's center.
      The graph below shows the declination of the "artificial equator" for a mapped area with a center that a a lattitude of 45 degrees.
      The inset at the corner at the upper right corner of graph shows the "artificial equator's" declination labeled a. The declination is calculated by taking the sine of the difference of X from Xc where Xc is the longitute at the mapped area's center and X is any longitude in the mapped area.
      b is the distance along the line of lattitude at lattitude Yc, where Yc is the lattitude at the center of the mapped area.
      b is adjusted by multiplying it by the cosine of the lattitude Yc since the distances between lines of longitude decrease at they near the poles.
     The transformation is made by considering that the "artificial equator" represented by the line labeled c runs horizontally across the mapped area. The only mapped line of longitude that is considered perpendicular to the "artificial equator" this the one that runs through Xc.
      d is Y-Yc. d is at the Xc,Yc end of the c line and it is d is perpendicular to the the c line.
      e is the distance along the line of longitude at Y. It is composed of d and a. e is the the other end of the c line.
      f and g are set to 1 or -1 to designated direction from Xc,Yc for X and Y respectively.
      h then is the third side of the right triangle with d and c as the other two sides. XMxYMx.jpg
      i is the angle between c and h.
      j is the angle between h and e. (line e and line line l are nearly on top of each other and hard to tell apart,line e and line line l have common end points Xa,Ya, but diverge by distance m when they reach line c)     j is calculated using the law of cosines.
      k is the sum of i and j. k is the angle from c to e.
      l is is the perpendicular distance from the c line to the transformed value Ya for Y. l is the vertical component of the e line.
      m is the horizontal component of the e line. m is subtracted from c to get n.
      n is the displacement of Xa from Yc.
      On the diagram Xa,Ya designates the transformed point. On the diagram X,Y designates a transformation where the only adjustment was multiplying the longitudenal difference by the cosine of Yc's lattitude.
Values below are from Demonstration Calculator

XMax YMax
Xc = -100 Yc= 45
X = -88 Y= 54
xAdj = -91.57181607244216 yAdj= 54.98270834089053
xAdjS = -91.51471862576143 yAdjS= 54
a = -0.983357966978744
b = 8.485281374238571
c = 8.542071931985857
d = 9
e = 9.983357966978744
f = 1
g = 1
h = 12.408343680412008
i = 46.49534150578617
j = 42.85102636443159
k = 89.34636787021776
l = 9.98270834089053
m = 0.11388800442802265
n = 8.428183927557834